
Generating Charts
GA3 has a number of charts available to view / print. To view charts you would need to go to
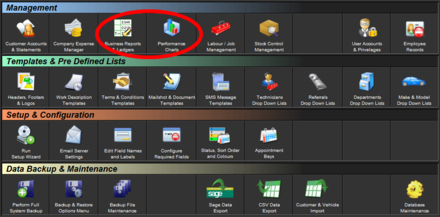
1. Admin
2. Performance Charts
You are then given a variety of options such as selecting a year or range, department, customer and chart type
The list of available charts include :
- Gross Sales
- Gross Sales & Previous Year Comparison
- Gross Sales with split data (labour / parts)
- Referral Statistics
- Overall Department Totals
- Count of Vehicle Manufacturers
- Count of Invoices per technician
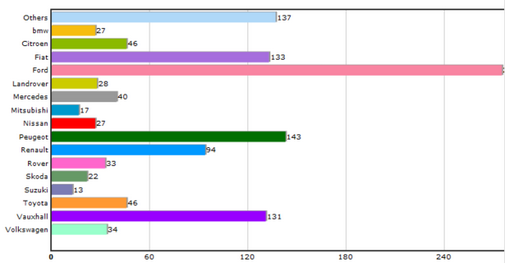
For instance, the chart below shows how many vehicles of each manufacturer have been worked on in 2009. This gives us a good indication that our most popular vehicle in for work is Ford.
Print Back to other articles